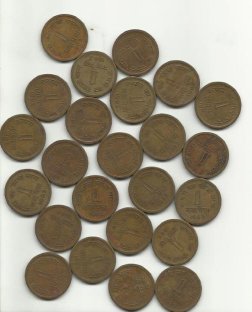
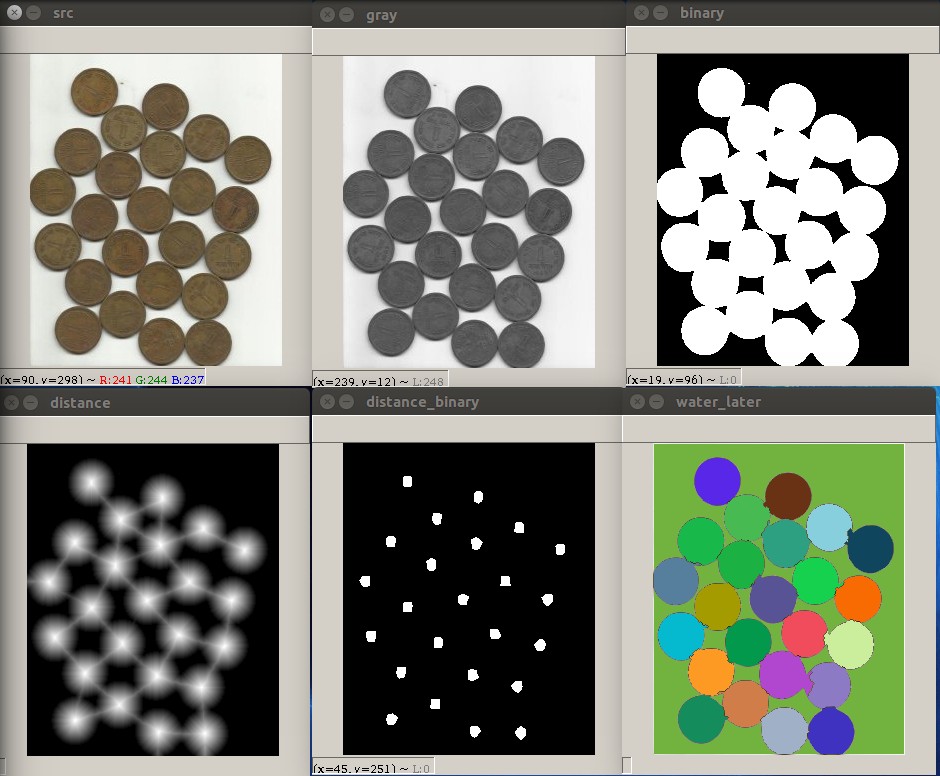
官方例程:https://opencv-python-tutroals.readthedocs.io/en/latest/py_tutorials/py_imgproc/py_watershed/py_watershed.html?highlight=coins

简单描述

coins

  1. 获取需要分割的图片
  2. 转化为灰度图
  3. 转化为二值图
  4. 转化为距离图
  5. 分离距离图,转化为二值图
  6. 查找距离二值图的轮廓
  7. 给二值图轮廓中的每个点进行颜色标记,从1开始标记
  8. 将标记的图转化为固定类型的标记图(CV_32S类型)
  9. 在标记图中将二值图黑色的区域对应的位置设置标记为轮廓的数量加1。(非常重要,后面介绍)
  10. 使用分水岭算法将标记的图和原图关联起来。
  11. 给标记图中每块标记区域上色

话不多说,先贴代码

Python实现

1
2
3
4
5
6
7
8
9
10
11
12
13
14
15
16
17
18
19
20
21
22
23
24
25
26
27
28
29
30
31
32
33
34
35
36
37
38
39
40
41
42
43
44
45
46
47
48
49
50
51
52
53
54
55
56
57
58
59
60
61
62
63
64
65
66
67
68
69
import cv2 as cv
import numpy as np


def findMarkers(distance_binary, binary, isSystem):
if isSystem:
# 6-8 步 使用 OpenCV 提供的函数替代
compCount, markers = cv.connectedComponents(distance_binary)
# 9. 在标记图中将二值图黑色的区域对应的位置设置标记为轮廓数量加 1
# 注: connectedComponents 函数的返回值就是轮廓数加1
markers[binary == 0] = compCount
else:
# 6. 查找距离二值图的轮廓
_, contours, _ = cv.findContours(
distance_binary, cv.RETR_EXTERNAL, cv.CHAIN_APPROX_SIMPLE)

# 7. 给二值图轮廓中的每个点进行颜色标记,从 1 开始标记
compCount = len(contours)
for index in range(compCount):
cv.drawContours(distance_binary, contours, index, index+1, -1)

# 8. 将标记的图转化为固定类型的标记图
markers = np.int32(distance_binary)

# 9. 在标记图中将二值图黑色的区域对应的位置设置标记为轮廓数量加 1
compCount += 1
markers[binary == 0] = compCount
return compCount, markers


# 1. 获取需要分割的图片
src = cv.imread("./img/coins.jpg")
cv.imshow("src", src)

# 2. 转化为灰度图
gray = cv.cvtColor(src, cv.COLOR_BGR2GRAY)
cv.imshow("gray", gray)

# 3. 转化为二值图
_, binary = cv.threshold(gray, 0, 255,
cv.THRESH_BINARY_INV | cv.THRESH_OTSU)
cv.imshow("binary", binary)

# 4. 转化为距离图
distance = cv.distanceTransform(binary, cv.DIST_L2, 3)
# 将距离图标准化到 0,1 之间
cv.normalize(distance, distance, 0, 1.0, cv.NORM_MINMAX)
cv.imshow("distance", distance)

# 5. 分离距离图, 转化为二值图
_, distance_binary = cv.threshold(distance, 0.8, 255, cv.THRESH_BINARY)
distance_binary = distance_binary.astype(np.uint8)
cv.imshow("distance_binary", distance_binary)

compCount, markers = findMarkers(distance_binary, binary, False)

# 10. 使用分水岭算法注水
cv.watershed(src, markers)

# 11. 给注水之后的标记图上色
for index in range(1, compCount+1):
src[markers == index] = np.random.randint(0, 256, size=(1, 3))
cv.imshow("water_later", src)

while (True):
s = cv.waitKey(100)
if s == ord('q'):
break
cv.destroyAllWindows()

C++ 实现

1
2
3
4
5
6
7
8
9
10
11
12
13
14
15
16
17
18
19
20
21
22
23
24
25
26
27
28
29
30
31
32
33
34
35
36
37
38
39
40
41
42
43
44
45
46
47
48
49
50
51
52
53
54
55
56
57
58
59
60
61
62
63
64
65
66
67
68
69
70
71
72
73
74
75
76
77
78
79
80
81
82
83
84
85
86
87
88
89
90
91
92
93
94
95
96
97
#include "opencv2/opencv.hpp"
#include <iostream>

using namespace std;
using namespace cv;

void findMarkers(const Mat &distance_binary, const Mat &binary, Mat &markers,
int &compCount, bool isSystem) {

if (isSystem) {
// 6-8 步 使用 OpenCV 提供的函数替代
compCount = connectedComponents(distance_binary, markers);
// 9. 在标记图中将二值图黑色的区域对应的位置设置标记为轮廓数量加 1
// 注: connectedComponents 函数的返回值就是轮廓数加1
markers.setTo(compCount, 255 - binary);
} else {
// 6. 查找距离二值图的轮廓
vector<vector<Point>> contours;
findContours(distance_binary, contours, RETR_EXTERNAL,
CHAIN_APPROX_SIMPLE);
compCount = contours.size();

// 7. 给二值图轮廓中的每个点进行颜色标记,从 1 开始标记
for (int i = 0; i < compCount; i++) {
drawContours(distance_binary, contours, i, Scalar(i + 1), -1);
}

// 8. 将标记的图转化为固定类型的标记图
distance_binary.convertTo(markers, CV_32S);

// 9. 在标记图中将二值图黑色的区域对应的位置设置标记为轮廓数量加 1
markers.setTo(++compCount, 255 - binary);
}
}

int main() {

// 1. 获取需要分割的图片
Mat src = imread("./img/coins.jpg");
imshow("src", src);

// 2. 转化为灰度图
Mat gray;
cvtColor(src, gray, COLOR_BGR2GRAY);
imshow("gray", gray);

// 3. 转化为二值图
Mat binary;
threshold(gray, binary, 0, 255, THRESH_BINARY_INV | THRESH_OTSU);
imshow("binary", binary);

// 4. 转化为距离图
Mat distance;
distanceTransform(binary, distance, DIST_L2, 3);
// 将距离图标准化到 0, 1 之间
normalize(distance, distance, 0, 1, NORM_MINMAX);
imshow("distance", distance);

// 5.分离距离图,转化为二值
Mat distance_binary;
threshold(distance, distance_binary, 0.8, 255, THRESH_BINARY);
// 5.1 将distance_binary 转化到 CV_8U
Mat distance_binary2;
distance_binary.convertTo(distance_binary2, CV_8U);
imshow("distance_binary", distance_binary2);

// 6-9 步
Mat markers;
int compCount;
findMarkers(distance_binary2, binary, markers, compCount, true);

// 10. 使用分水岭算法注水
watershed(src, markers);

// 11. 给注水后的标记图上色
vector<Vec3b> colorTab;
RNG rng;
for (int i = 0; i < compCount; i++) {
int g = rng.uniform(0, 255);
int b = rng.uniform(0, 255);
int r = rng.uniform(0, 255);
colorTab.emplace_back(g, b, r);
}

for (int i = 0; i < markers.rows; i++)
for (int j = 0; j < markers.cols; j++) {
int index = markers.at<int>(i, j);
if (index <= 0 || index > compCount)
src.at<Vec3b>(i, j) = Vec3b(0, 0, 0);
else
src.at<Vec3b>(i, j) = colorTab[index - 1];
}
imshow("water_later", src);

waitKey();
destroyAllWindows();
}

最终显示结果

这里仅仅使用 Python 版代码的截图,C++版运行结果是一样的。

coins_result

思路分析

在分水岭算法中,我们要找到分割次数,就是要找到标记点,即Markers

在本例中使用距离变换算法统计出硬币的个数,即24个,使用距离变换后的二值图,可以很好的打出24个标记,标记每一个硬币。但是我们还需要将背景屏蔽掉,即将不是硬币的地方打一个标记,不然使用分水岭算法的时候水会漫出去导致未找到正确的边界。


思路分析清晰,最后剩下的就是怎么打标记的问题了?

两种解决办法:

  1. 查找轮廓
  2. 使用系统的connectedComponents的函数

用轮廓查找来打标记

仅使用 Python 代码来分析逻辑,C++ 同理

再贴一遍代码

1
2
3
4
5
6
7
8
9
10
11
12
13
14
15
# 6. 查找距离二值图的轮廓
_, contours, _ = cv.findContours(
distance_binary, cv.RETR_EXTERNAL, cv.CHAIN_APPROX_SIMPLE)

# 7. 给二值图轮廓中的每个点进行颜色标记,从 1 开始标记
compCount = len(contours)
for index in range(compCount):
cv.drawContours(distance_binary, contours, index, index+1, -1)

# 8. 将标记的图转化为固定类型的标记图
markers = np.int32(distance_binary)

# 9. 在标记图中将二值图黑色的区域对应的位置设置标记为轮廓数量加 1
compCount += 1
markers[binary == 0] = compCount
  1. 因为图片已经是距离变换后的二值化的图了,所以能查找到准确的轮廓。
  2. 查找到轮廓后,给每个轮廓填充不一样的颜色即可(本质就是标记,好让分水岭算法去计算边界)
  3. 背景也要打上一个标记(这步很重要,不然会粘连起来)

使用connectedComponents来打标记

1
connectedComponents(image, markers)
  1. image:要标记的8位单通道的图
  2. markers:输出的标记图

该方法在C++中有一个返回值,返回值的代表了标记的个数N

该方法在Python中有两个返回值,第一个代表标记的个数N和输出的标记图Markers

该方法要注意的是:标签总数为[0, N-1],0表示背景标签,即image为0的那部分。后面还需做特定的处理。

评论